DATA VISUALIZATION SOLUTIONS
Our data visualization experts and professionals will assist you with leveraging actionable insights from multiple sources and transform them into interactive visualizations, allowing you to track goals and results, uncover opportunities, estimate demand, and more.
Data Visualization Services That Transform Raw Data Into Strategic Insights
Interactive Dashboards • Advanced Analytics • Actionable Business Intelligence
We at Akratech specialize in turning complex datasets into clear visual stories that drive smarter decisions. Our full-spectrum data visualization services bridge the gap between technical analysis and business strategy.

Our Data Visualization Solutions
![]() Dashboard Optimization: BI Dashboards combine engaging, actionable graphics with built-in performance architecture to deliver insights on mobile and web devices. This procedure can shorten load times and improve engagement.
Dashboard Optimization: BI Dashboards combine engaging, actionable graphics with built-in performance architecture to deliver insights on mobile and web devices. This procedure can shorten load times and improve engagement.
![]() Data Preparation: Data preparation is a common method of preparing data sets for use in business intelligence (BI) and analytics applications. It gathers, cleans, and unifies raw data in order to provide considerable economic value.
Data Preparation: Data preparation is a common method of preparing data sets for use in business intelligence (BI) and analytics applications. It gathers, cleans, and unifies raw data in order to provide considerable economic value.
![]() Data Platform Development: A data platform is a service that collects, stores, and analyses data. Creating a data platform results in the creation of a centralized service that includes business intelligence tools, a data warehouse, and a set of data science and analytical environments.
Data Platform Development: A data platform is a service that collects, stores, and analyses data. Creating a data platform results in the creation of a centralized service that includes business intelligence tools, a data warehouse, and a set of data science and analytical environments.
![]() Dashboard Development: Data visualization can help you improve your business intelligence and analytics. We create complete data dashboards and reports for a wide spectrum of corporate users, from data analysts to non-analytic users.
Dashboard Development: Data visualization can help you improve your business intelligence and analytics. We create complete data dashboards and reports for a wide spectrum of corporate users, from data analysts to non-analytic users.
Why Choose Us?

We don’t just analyze data—we convert raw observations into actionable intelligence, empowering businesses to solve complex challenges with algorithmic precision. Our expertise bridges the gap between data science and business strategy, delivering bulletproof solutions backed by advanced analytics.
![]() How We Drive Value for Your Business.
How We Drive Value for Your Business.
![]() Predictive Analytics & AI Modeling.
Predictive Analytics & AI Modeling.
![]() Advanced Statistical &Quantitative. Analysis.
Advanced Statistical &Quantitative. Analysis.
![]() End-to-End Data Visualization & Storytelling.
End-to-End Data Visualization & Storytelling.
![]() Data Mining & Survey Design
Data Mining & Survey Design

Data Exploration Analysis and Insight
Our data visualization experts don’t just present numbers—we uncover hidden stories in your data. Using advanced mathematical modeling and intuitive visual storytelling, we help you:
![]() Discover actionable insights through texture, dimension, and correlation analysis
Discover actionable insights through texture, dimension, and correlation analysis
![]() Build scalable data products that drive decision-making
Build scalable data products that drive decision-making
![]() Communicate complex findings clearly to stakeholders
Communicate complex findings clearly to stakeholders
Advanced Algorithms Machine Learning

We specialize in deconstructing high-dimensional challenges and recomposing them into elegant solutions. Our team combines:
![]() Deep Technical Expertise in SQL, Python, R, SAS, Java, Scala, and Julia
Deep Technical Expertise in SQL, Python, R, SAS, Java, Scala, and Julia
![]() System Architecture Knowledge for seamless integration with your data infrastructure
System Architecture Knowledge for seamless integration with your data infrastructure
![]() Prototyping Agility to deliver quick proofs-of-concept
Prototyping Agility to deliver quick proofs-of-concept

Data Product Engineering
Our experience in building data products revolves around processing data to algorithmically-generated results.
We engineer algorithmically-powered data products that:
![]() Process raw data into actionable outputs.
Process raw data into actionable outputs.
![]() Surface hidden behavioral patterns through granular analysis.
Surface hidden behavioral patterns through granular analysis.
![]() Enable smarter decisions.
Enable smarter decisions.
Our Computational Competency in Data Visualization

![]() Experience in Python / R Language
Experience in Python / R Language
![]() Data scraping and API Design
Data scraping and API Design
![]() Data normalization and distribution
Data normalization and distribution
![]() Knowledge of probability and statistics.
Knowledge of probability and statistics.
![]() Experience in Data visualization and related tools.
Experience in Data visualization and related tools.
![]() Experimental design and adaptive experimentation methods.
Experimental design and adaptive experimentation methods.
![]() Data collection and cleaning
Data collection and cleaning
![]() Relational database management with SQL or NoSQL document database topology
Relational database management with SQL or NoSQL document database topology
![]() Applied Mathematics – Linear Algebra and Calculus
Applied Mathematics – Linear Algebra and Calculus
![]() Algorithms and data structures – Sorting, Trees, Graphs, and Data Topology Design
Algorithms and data structures – Sorting, Trees, Graphs, and Data Topology Design
Data Visualization Services we Provide
See Your Data Like Never Before!
Our data visualization experts bring clarity to complexity with interactive dashboards and insightful reports. Let’s optimize your strategy together!
Want to see the impact? Fill out the form for a free consultation today!
Our Recent Experience in Data Visualization
![]() Data Visualization through Tableau: We have created various visualizations using dashboard views for any kind of data representation, through the use of Tableau for analytical reporting. We have created a visualization for E-commerce stores, offline stores, and many more. Finally, we deliver clean data in the client’s preferred format.
Data Visualization through Tableau: We have created various visualizations using dashboard views for any kind of data representation, through the use of Tableau for analytical reporting. We have created a visualization for E-commerce stores, offline stores, and many more. Finally, we deliver clean data in the client’s preferred format.
Our Visual Analytics interface makes it easy for a human user to understand the results, and also make changes simultaneously that further direct the computer’s algorithmic process.
We have provided you insight into solving a problem displayed in an interactive, graphical manner. Our Visual Analytics can be perceived as an integrated approach that combines visualization, human factors, and data analysis.
![]() Dashboard and Reporting Tool: As the trend & insights are included in the dashboard, it gives you the ability to make better, well-informed decisions based on both past performance and future prediction of performance. When used in this manner, the dashboard becomes a valuable decision-support tool that is based on business intelligence.
Dashboard and Reporting Tool: As the trend & insights are included in the dashboard, it gives you the ability to make better, well-informed decisions based on both past performance and future prediction of performance. When used in this manner, the dashboard becomes a valuable decision-support tool that is based on business intelligence.
Our reporting tools provide status to top management on a regular basis, both in informal and more formal reviews. The performance indicator can be used by the managers to summarize the overall status based on input and discussion with the team. There is a direct correlation between the summary status report and the performance indicator.
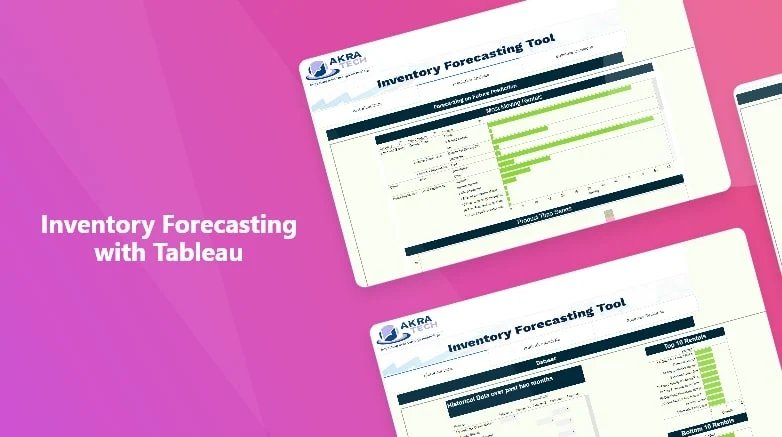
![]() Inventory Forecasting with Tableau: We have built an inventory forecasting tool with the help of Python and Tableau to create a dashboard view in the application which displays the forecasting information. This helps in the analysis and forecast of the future requirement of products for any store. Our dependable and efficient forecasting tool provides an analytical approach to your team members for making business decisions faster and with precision.
Inventory Forecasting with Tableau: We have built an inventory forecasting tool with the help of Python and Tableau to create a dashboard view in the application which displays the forecasting information. This helps in the analysis and forecast of the future requirement of products for any store. Our dependable and efficient forecasting tool provides an analytical approach to your team members for making business decisions faster and with precision.
Data visualization allows us to create custom dashboards to track all key product/store metrics and that provide ongoing alerts when metrics fall below a certain threshold.
Data Visualization Techniques
![]() Line Chart
Line Chart
![]() Scatter Plot
Scatter Plot
![]() Heat MAP
Heat MAP
![]() Matrix
Matrix
![]() Connectivity Chart
Connectivity Chart
![]() Bar Chart
Bar Chart
![]() Pie Chart.
Pie Chart.
![]() Funnel Chart
Funnel Chart
![]() Symbol Map
Symbol Map

Data Visualization tools